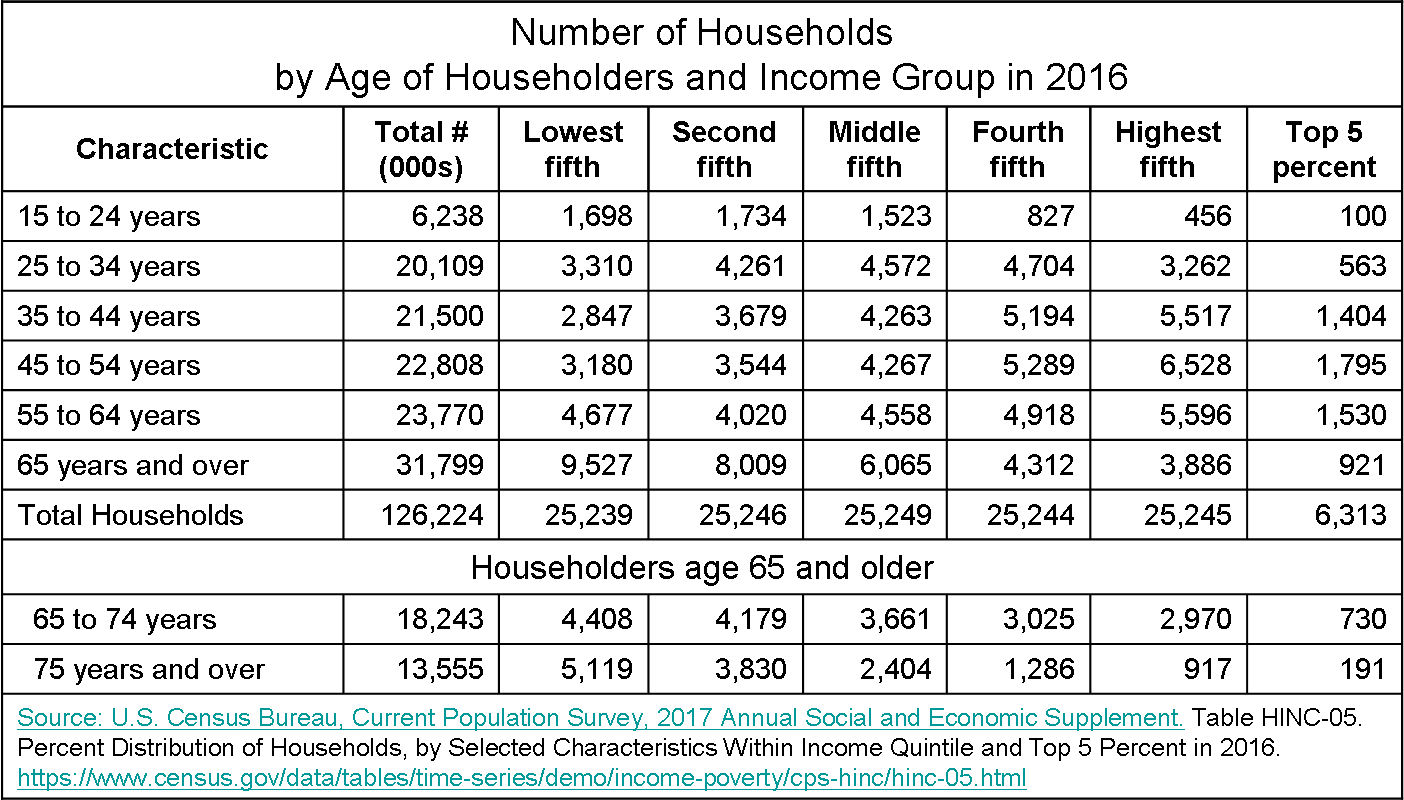
The Census Bureau just came out with a bunch of data on US households from 2016. The data cover selected characteristics of households within different income groups. Here are the income groups along with the lower income limit for each:
Before I begin to dive into this glorious mess, a few definitions are in order. According to the Census Bureau, a household consists of all people who occupy a housing unit regardless of relationship. A household may consist of a person living alone or multiple unrelated individuals or families living together. A housing unit may be a house, an apartment, or other group of rooms, or a room. A group of rooms or a single room is regarded as a housing unit when it is occupied as separate living quarters. The Census Bureau uses the term "householder" for what used to be called the "head of household" or "head of family".
My main interest in this series is to explore the characteristics associated with each household income group. To this end, I converted the raw numbers provided by the Census Bureau into percent distributions within each household group. Without further ado, let’s look at the age breakdown within each household category:
A few observations. Lower income households skew old: 57% are 55 or older, an age group likely to be dominated by retirees and disabled folk*. Affluent households skew middle aged, but once they hit the golden years, their numbers dwindle, as is apparent in the following:
For affluent oldsters, I suspect such a quick drop in income is the result of cashing in on assets to meet the exigencies of bucket lists and healthcare.
Next: Household Income and Number of Earners within Households.
--
*According to the Social Security Administration, over five million Social Security Disability beneficiaries are between 55 and 64. The federal government doesn't provide such detailed information on the age breakdown of SSI recipients but I'm pretty sure that SSI beneficiaries skew older and poorer, given benefit eligibility requirements.


