The Organization for Economic Cooperation and Development (OECD) is a club of mostly rich countries whose mission is to “promote policies that will improve the economic and social well-being of people around the world”. To this end, the OECD collects tons of data, often summarized in beautiful charts. The information collected by the OECD is invaluable for evaluating and devising policies to address the world's many ills. Take, for example, how different countries tax their citizens, about which much nonsense has been spouted.
Check it out:
Keep in mind the above chart is about tax revenue, not tax rates. The average OECD tax revenue is 34.2% of a country's GDP. The US revenue take is 25.9%. Denmark's is the highest, at 49.6% of GDP. Take home: the USA doesn't tax its citizens all that much, compared to its OECD brethren.
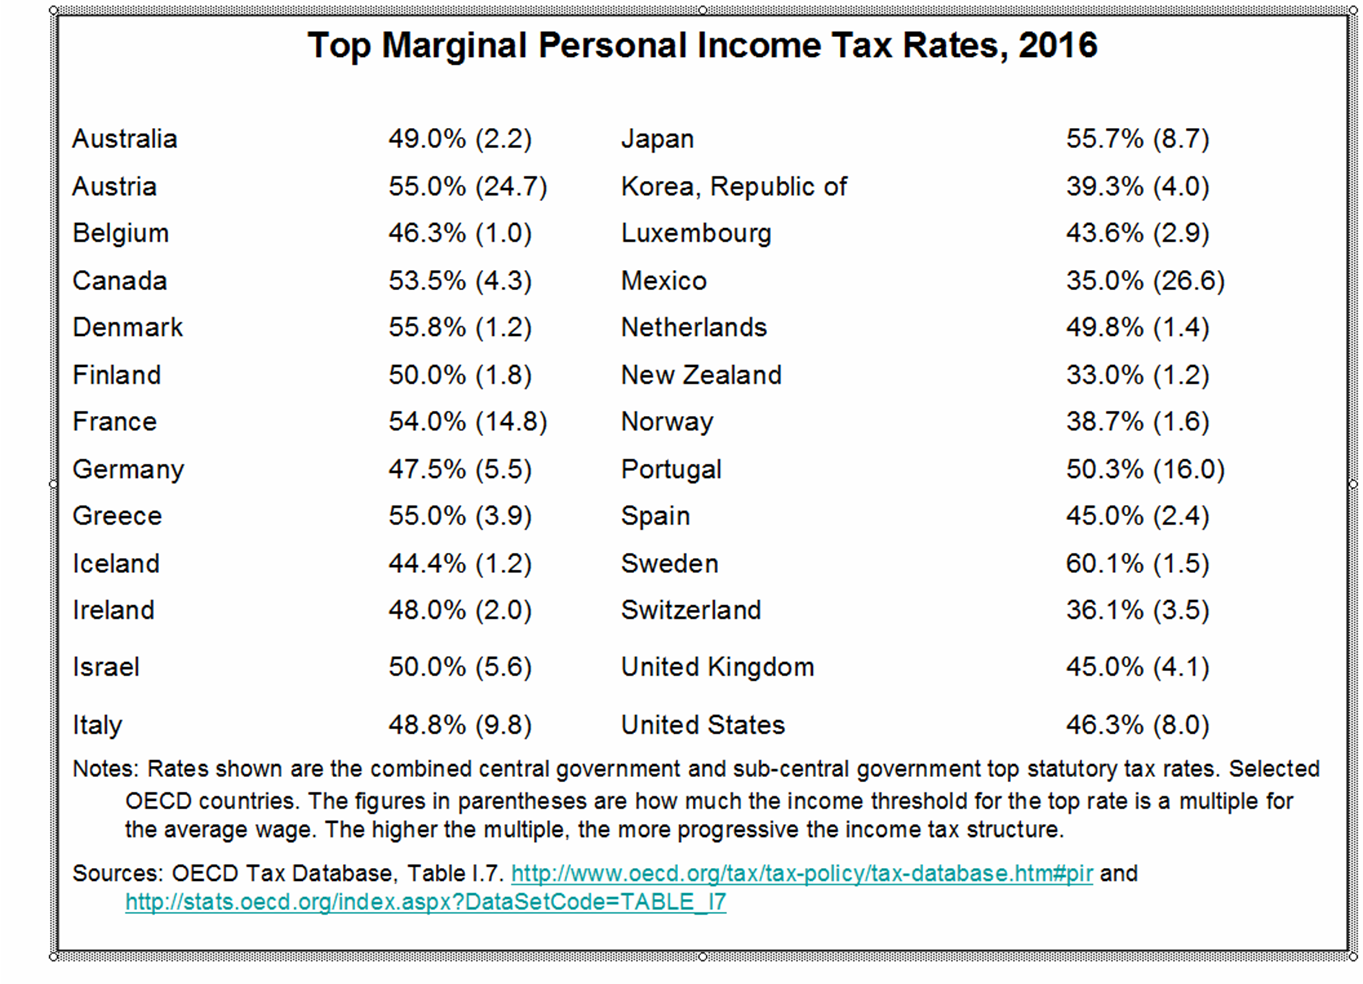
But overall tax revenue is only part of the story. Another question is: who's paying the taxes? To answer this question, you have to consider the type of tax. Take, for instance, income tax:
Here we have the top income tax rate, plus how much the income threshold for that rate is a multiple of tax rate for the average wage earner - meaning, how much more does the richest taxpayer pay in income taxes compared to the average worker? Simplifying a bit, the higher the multiple, the more progressive the income tax system is. The US is about average as far as top income tax rate is concerned (46.3%) but that rate is 8 times the rate of the average wage earner. Compare to the Scandinavians, where the highest multiple is 1.5 times the average wage. What does this mean? That as far as income tax goes, US income taxes are much more progressive than the semi-socialist Scandinavian tax systems.
Ok, but income taxes are only part of the mix. We already know that most other rich club countries squeeze more taxes out of their citizens. How are they getting all that money? Glad you asked:
Don’t look too closely. The point is to get an impression. Long story short: orange (taxes on goods and services) is more regressive than blues and greens (income and social security taxes). The US green-blue is above 70% - the highest of the lot. Other OECD countries get a lot more revenue from taxes on goods and services, paid care of regular folk.
Bottom line: the US has the most progressive tax system in the OECD (meaning the rich pay a lot more than the average Joe/Josephine), but its overall tax revenue is well below the OECD average. Something to think about. There are policy implications here, but it will take me awhile to sort it all out.
--
Link: Tax Revenue Statistics 2016 OECD


