Large American cities are usually run by Democrats, but a few have Republican mayors. I’m interested in whether large cities with Republican mayors are safer than those with Democrat mayors and if so, why.
In previous posts, I focused on the violent crime rates of 20 large cities, ten with Republican mayors and ten with Democratic mayors (here and here). I also looked at clearance rates for violent crimes in 19 of these cities (here), meaning the rate of violent crimes “solved for reporting purposes”, usually by arrest. The pattern I found was clear: the large cities with Republican mayors had lower violent crime rates and higher clearance rates than those with Democrat mayors. Interesting, but a pattern doesn’t establish causality. For instance, perhaps the residents of cities with Republican mayors are somewhat older, on average, than the residents of cities with Democratic mayors, and older residents are less likely to commit violent crimes and more likely to cooperate with police during criminal investigations. Perhaps the mayor’s policies, priorities or actions make little difference in crime and clearance rates.
Then again, how would we know one way or the other? The demographic theory is easy to test - just get the age breakdown of city residents, offenders and individuals who cooperate with police during criminal investigations, and look for patterns across political affiliation of mayors. But drawing a clear causal line from mayor to policy or actions to crime rates is another matter altogether. For one thing, you’d have to identify causal mechanisms along the causal pathway; those are the events that move causality forward to eventually bring about an outcome of interest, in this case crime and clearance rates. For example, a possible causal chain could be: mayor appoints police chief, who implements procedures that improve police response times, which increase clearance rates, which reduce crime rates. Of course, this is a gross simplification of how things happen in reality and a finer-grain analysis would come up with several conditions and mechanisms between each point in the chain, from mayor to crime rates. But you don’t need to know everything to know enough for the task at hand, whether you’re a doctor treating an infection or a police chief trying to clear more crimes.
Which brings me to the time it takes for police to respond to calls for service, aka response times. As a general rule, faster response times lead to higher crime clearance rates. Per a recent study:
“… a 10% increase in response time leads to a 4.7 percentage points decrease in the likelihood of clearing the crime. We find stronger effects for thefts than for violent offences, although the effects are large for every type of crime. We find suggestive evidence in support of two mechanisms: the likelihood of an immediate arrest and the likelihood that a suspect will be named by a victim or witness both increase as response time becomes faster.” - Vidal & Kirchmaier (2018) The Effect of Police Response Time on Crime Clearance Rates
In contrast,
“…longer response times reduce the likelihood that an incident will be successfully reported to police which in turn leads to crimes being undercounted” - Jeff Asher (2023) Police Are Taking Longer to Respond
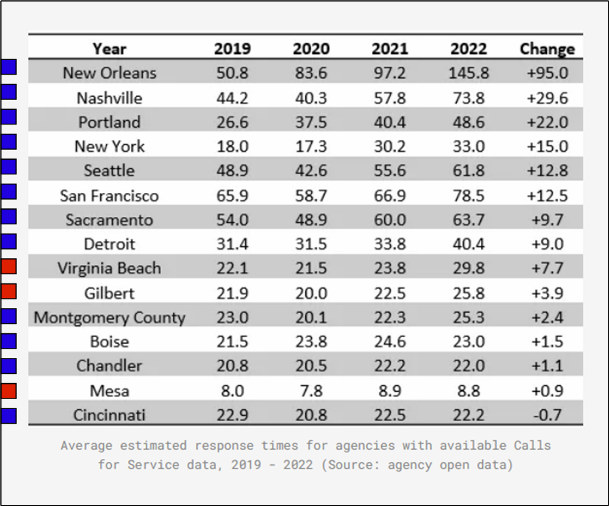
Unfortunately, response time data is hard to come by in this country. There’s no national organization that collects it and a lot of metro police departments don’t publish it, including many of the departments in cities I had previously explored in this series. Luckily Jeff Asher of the crime blog Jeff-alytics did collect response time data for a different group of cities. Here is Jeff’s list, color-coded by me (red-Republican/blue-Democrat) to indicate the political party of each city’s mayor:
Hmm. Not enough Republican mayors to do a meaningful comparison of cities by the politics of their mayors. But those numbers are pretty depressing and invite further scrutiny.
Next: Response rates, crime victimization and perceived public safety: are they connected? The case of San Francisco.
—
References:
Jeff Asher/Jeff-alytics Police Are Taking Longer to Respond January 9, 2023
Jordi Blanes i Vidal , Tom Kirchmaier, The Effect of Police Response Time on Crime Clearance Rates, The Review of Economic Studies, Volume 85, Issue 2, April 2018, Pages 855–891, https://doi.org/10.1093/restud/rdx044
Julie Fritz Average Police Response Times In The U.S. By City, State, & Crime Last updated March 10, 2023
